In the era of artificial intelligence and machine learning, understanding how models make decisions has become crucial for ensuring transparency and trust. Model interpretability techniques like Partial Dependence Plots (PDP), Individual Conditional Expectation (ICE), Local Interpretable Model-agnostic Explanations (LIME), and SHapley Additive exPlanations (SHAP) provide powerful tools to peek inside the black box of complex algorithms.
The pursuit of transparent artificial intelligence has never been more critical. As organizations deploy increasingly sophisticated algorithms across high-stakes domains, the demand for model interpretability has transcended academic curiosity to become a regulatory and ethical imperative. Understanding how models make decisions is no longer optional—it’s essential for building trust, ensuring fairness, and maintaining accountability in our AI-driven world.
Model interpretability addresses the fundamental challenge of making black box systems comprehensible to human stakeholders. When a loan application is denied, a medical diagnosis is suggested, or a hiring decision is influenced by algorithmic recommendations, affected parties deserve meaningful explanations. This transparency serves multiple constituencies: end-users seeking justification for decisions that impact their lives, practitioners needing to debug and improve model performance, and regulators ensuring compliance with emerging AI governance frameworks.
The interpretability landscape encompasses diverse methodological approaches, each with distinct strengths and limitations. Partial Dependence Plots reveal how individual features influence predictions across the entire dataset, while LIME provides localized explanations by approximating complex models with simpler, interpretable surrogates around specific instances. SHAP leverages game theory to assign fair attribution scores to features, and Individual Conditional Expectation curves show how feature changes affect individual predictions, complementing the averaged perspectives of PDPs.
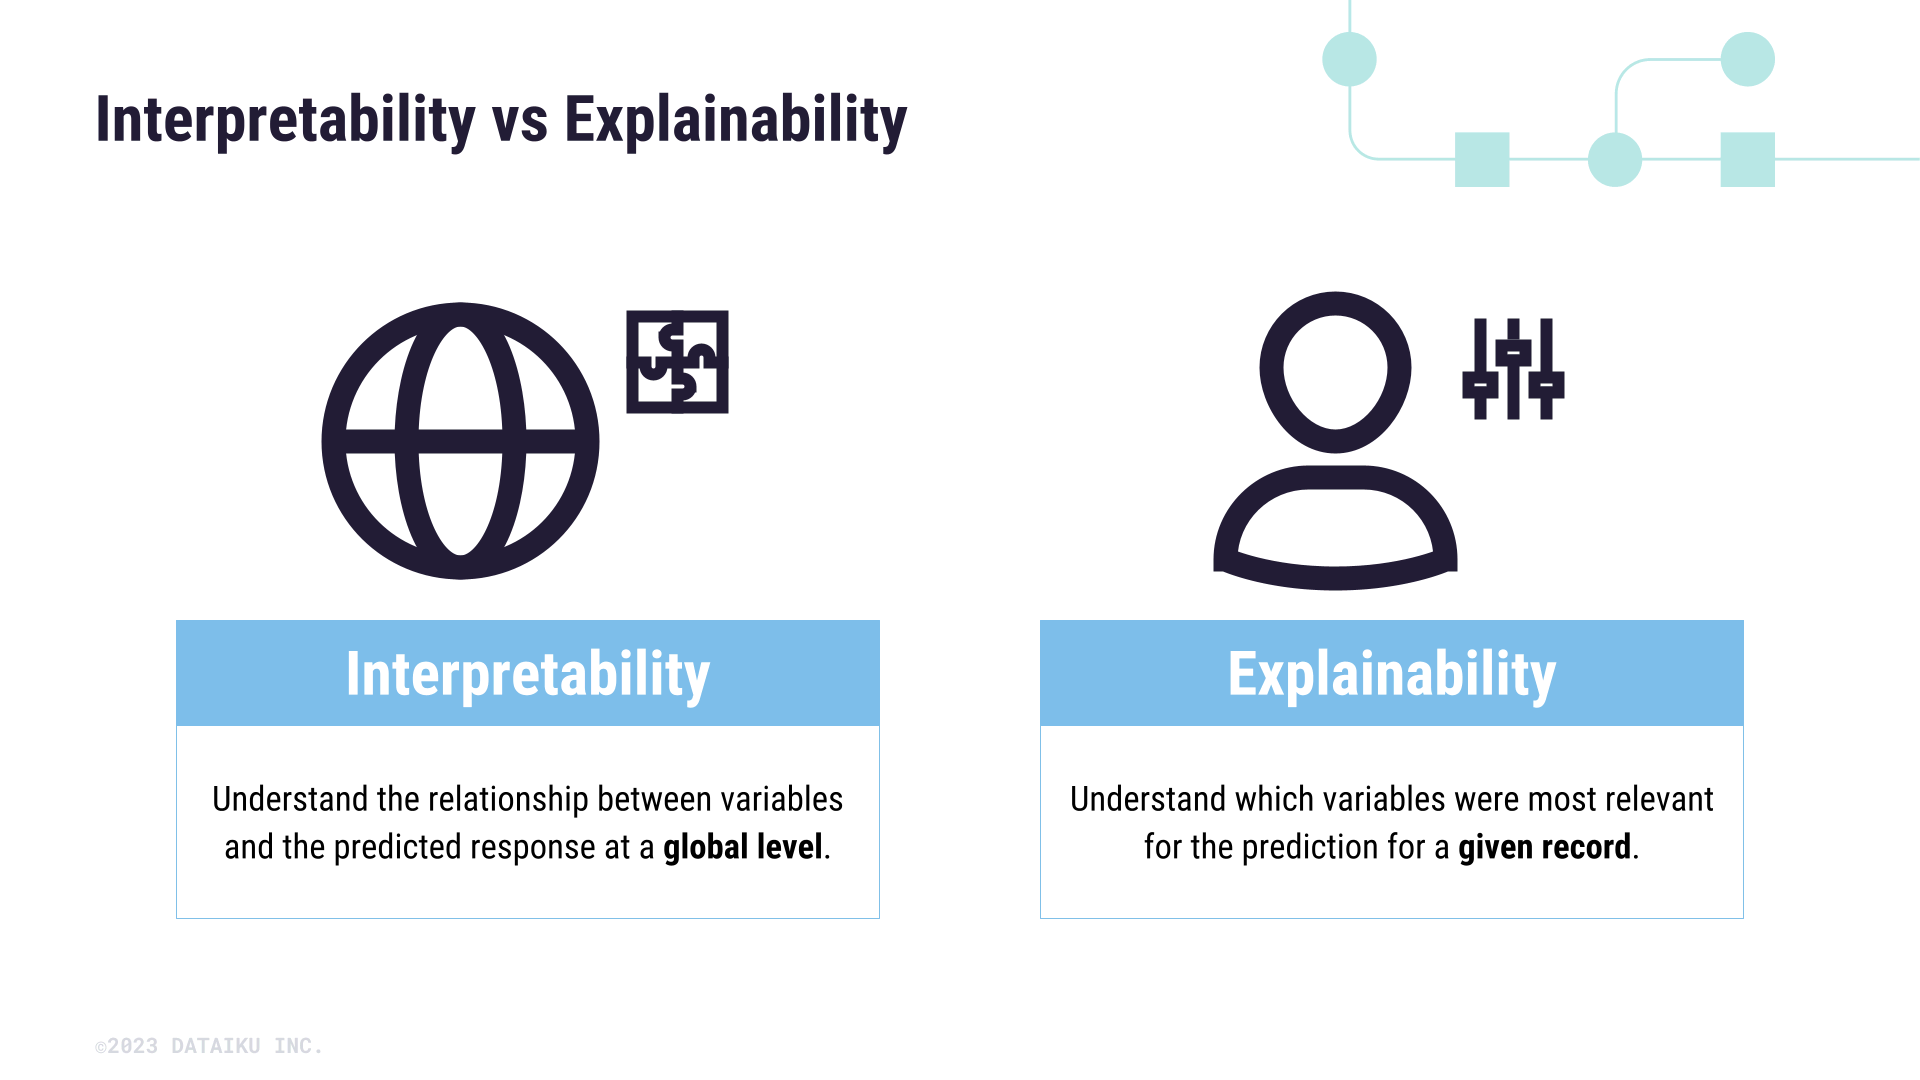
These techniques operate along a spectrum from global interpretability—understanding overall model behavior—to local interpretability—explaining specific predictions. The choice of method depends critically on context: regulatory compliance often demands consistent, theoretically grounded approaches like SHAP, while rapid prototyping might favor faster but less robust techniques like LIME. Success requires matching interpretability tools to specific stakeholder needs, model types, and deployment constraints while acknowledging that no single approach provides complete transparency into complex algorithmic decision-making.
Partial Dependence Plots (PDP)
Based on the previous chapter’s discussion of model interpretability importance, Partial Dependence Plots (PDPs) emerge as a fundamental technique for understanding how individual features influence model predictions. PDPs visualize the marginal effect of one or more features by averaging the model’s predictions across all possible values of other features, effectively isolating the relationship between the target feature and the predicted outcome.
The methodology involves creating a grid of values for the feature of interest, then systematically replacing that feature’s value in every data point while keeping other features unchanged. The model’s predictions are then averaged for each grid value, revealing how changes in the feature affect predictions on average. This approach makes PDPs model-agnostic, working equally well with tree-based models, neural networks, or any black-box algorithm.
However, PDPs carry a critical assumption: feature independence. When features are correlated—a common occurrence in real-world data—PDPs can generate misleading visualizations by forcing the model to evaluate unrealistic feature combinations. For instance, a PDP might show predictions for “zero income with luxury spending,” combinations that never occur naturally. This limitation becomes particularly problematic in domains like healthcare or finance where feature correlations are strong and interpretability errors have serious consequences.
Modern practitioners increasingly supplement PDPs with Accumulated Local Effects (ALE) plots for correlated features and uncertainty quantification techniques to provide confidence intervals around PDP estimates, addressing the statistical reliability concerns that have emerged in recent research.
Individual Conditional Expectation (ICE)
While Partial Dependence Plots reveal average feature effects, Individual Conditional Expectation (ICE) plots expose the heterogeneous relationships hidden beneath these averages. Unlike PDPs that aggregate predictions across all instances, ICE plots show how each individual data point responds as a single feature varies, creating multiple overlapping curves rather than one averaged line.
The mathematical foundation builds directly upon PDP methodology. For each observation i and feature xj, ICE computes f(xj, xc(i)) across a grid of xj values while holding all other features xc constant at their original values for that instance. This generates individual prediction trajectories that reveal subgroup behaviors PDPs might obscure through averaging.
ICE plots excel at detecting feature interactions and heterogeneous effects. When PDP shows a flat line suggesting no relationship, ICE often reveals opposing trends—some instances increasing while others decrease—that cancel out in the average. This capability proves invaluable for identifying bias patterns, understanding model fairness across demographic groups, or debugging unexpected predictions for specific cases.
Implementation requires generating multiple synthetic versions of each data point with only the target feature modified, then plotting all resulting prediction curves. Centered ICE plots enhance interpretability by subtracting each curve’s starting value, focusing attention on relative changes rather than absolute prediction levels. While computationally similar to PDP construction, ICE visualization can become cluttered with large datasets, typically requiring sampling or aggregation techniques for practical deployment.
Local Interpretable Model-agnostic Explanations (LIME)
While ICE plots reveal how individual instances respond to feature changes, Local Interpretable Model-agnostic Explanations (LIME) takes a fundamentally different approach to understanding model predictions. Instead of examining feature variations globally, LIME explains why a model made a specific prediction for a particular instance by creating locally faithful approximations using interpretable models.
LIME operates through strategic perturbation around the instance of interest. For tabular data, it samples from feature distributions while maintaining realistic value ranges. For text, it systematically removes words to observe prediction changes. For images, it masks superpixel regions to identify influential visual components. These perturbations generate a neighborhood dataset that LIME weights by proximity to the original instance.
The technique then trains an interpretable model—typically sparse linear regression—on this weighted neighborhood data. The resulting coefficients reveal which features contribute positively or negatively to the specific prediction. This local approximation provides intuitive explanations: highlighted words in sentiment analysis, influential image regions in computer vision, or critical feature thresholds in tabular predictions.
LIME’s model-agnostic nature makes it particularly valuable for debugging individual predictions and building stakeholder trust. Unlike ICE plots that show feature-prediction relationships across the dataset, LIME answers “Why did the model classify this specific email as spam?” by identifying the exact words or patterns that influenced that decision, making it indispensable for explaining high-stakes individual predictions in healthcare, finance, and legal applications.
SHAP (SHapley Additive exPlanations)
While LIME operates on local neighborhoods, SHAP (SHapley Additive exPlanations) provides a unified theoretical framework rooted in cooperative game theory. Unlike approximation-based methods, SHAP guarantees mathematically consistent explanations by treating each feature as a “player” and the prediction as a cooperative “payout.” This framework satisfies three critical properties: local accuracy (feature attributions sum to the difference between prediction and baseline), consistency (features with increased contributions never receive decreased attribution), and missingness (unused features receive zero attribution). TreeSHAP enables efficient computation for tree-based models, while KernelSHAP provides model-agnostic explanations. SHAP’s visualizations—including force plots, summary plots, and dependence plots—offer both local and global interpretability insights, making it particularly valuable for high-stakes applications requiring regulatory compliance and stakeholder trust in machine learning decisions.
Conclusions
Model interpretability techniques provide essential insights into complex machine learning systems, each offering unique perspectives and advantages. While PDPs and ICE plots excel at visualizing feature impacts, LIME and SHAP provide detailed local explanations. Together, these tools enable practitioners to build more transparent, trustworthy, and effective AI systems.